Keep data on your device or enable optional iCloud sync across your devices.
Personal finance tracking
Your budget, accounts, and data stay under your control.
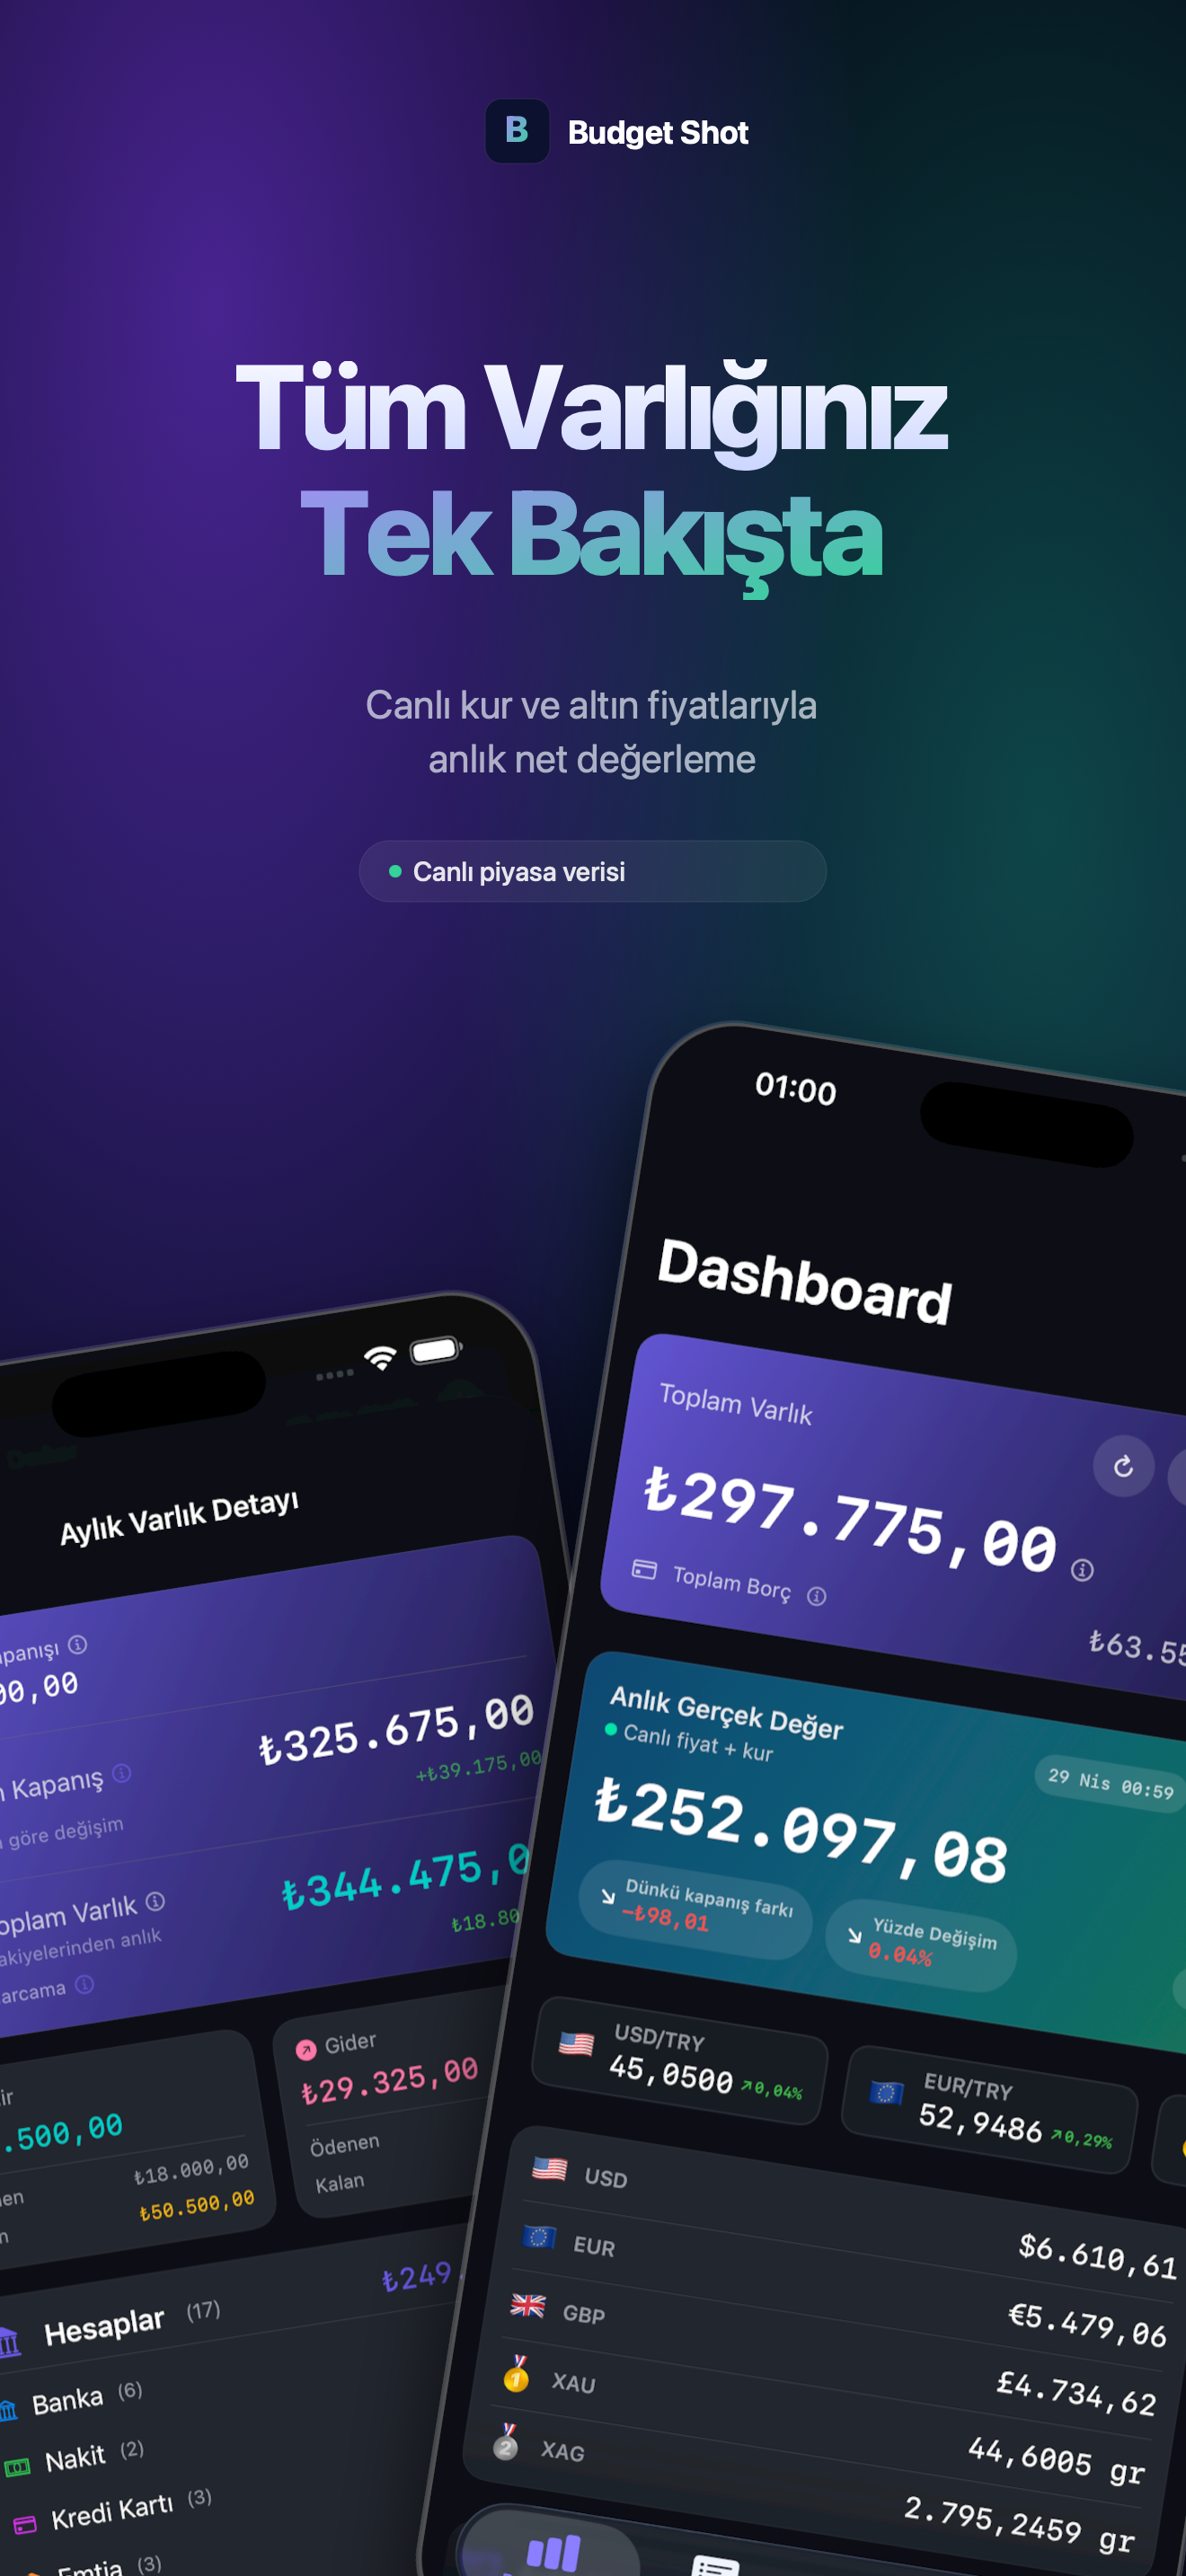
BudgetShot is a focused personal finance app for tracking accounts, transactions, budgets, and market views in one place.
Local or iCloud
Live market tracking
JSON backups
Manage daily finances at a glance.
Accounts, transactions, live market data, and portfolio views stay organized in one app.
Practical tools for everyday tracking.
BudgetShot keeps personal finance records simple while giving you a clear way to compare different asset types.
Connect exchange rates, commodities, and stock values to your portfolio tracking.
Categorize transactions to understand monthly budget and cash flow more clearly.
Track bank, currency, commodity, debt, receivable, loan, and stock accounts separately.
Export data as JSON and restore it later when needed.
Use local notifications for payment and credit card dates.
Detailed usage guide.
Expandable guides for account types, cost logic, live data, and period comparisons.
Accounts: account types, transaction logic, and cost calculations
The Accounts area keeps different financial records separated by type. Bank balances, currency positions, debts, loans, and stock movements each keep their own meaning instead of blending together.
Bank and cash accounts
Use these for day-to-day money movement such as salary, shopping, bills, and transfers. These accounts are usually the main source for budget and cash flow analysis.
Currency accounts: exchange rates and base currency value
Track balances in USD, EUR, or other currencies separately. The app converts total assets into your selected base currency using the relevant exchange rate. Historical views use rate data for that period, while current views can use live or latest available rates.
Commodity accounts: gold/silver quantity, multiplier, and cost
Track assets such as gold or silver with quantity and cost information. Quantity and multiplier details are preserved at transaction time, so gram, quarter, or other definitions can be normalized into total quantity. Cost views reflect recorded purchase cost, while live views help interpret current market value.
Debt and receivable accounts
Keep money you owe or expect to receive separate from everyday cash accounts. Payments or collections change the remaining amount, and the effect on total assets remains readable as debt or receivable impact.
Loan accounts
Track installments and remaining debt. Loan entries behave like a payment plan; the remaining liability decreases as installments are paid. Reminder settings can help with payment dates.
Stock accounts: cash entry, buys/sells, and open lot cost
- Cash entry means money transferred into the brokerage account. It is not a stock purchase; it tracks broker cash that can later be used for trades.
- Buy transactions create quantity and cost for a symbol. Average cost is calculated from the cost carried by the open lots.
- Sell transactions remove sold lots from the position. Sale proceeds do not directly push open position cost negative; the carried cost of the sold lot leaves the position.
- Transfer entries help keep portfolio movement separate from cash movement. Broker cash, lot movement, and total cost are not treated as the same concept.
- Live quotes show current market value when available; cost-based records still come from the transaction ledger.
Stock accounts: cash, ledger, commission, and profit/loss reading
A stock account tracks two separate concepts: brokerage cash movement and stock lot movement. This distinction matters because transferring money into the brokerage account is not a buy transaction, and selling shares does not mean open position cost should be reduced by sale price.
When should I use cash entry?
Use a cash entry when money is transferred into the brokerage account. It shows available broker cash before or after trades. For example, if you deposit 20,000 TRY and do not buy anything yet, you have cash balance but no stock lots.
How does a buy transaction create cost?
A buy transaction records symbol, quantity, price, and commission when available. Gross value is quantity times price; commission is included in the cost carried by the open position. Average cost is read from the cost carried by the remaining open lots.
Why does sale price not directly reduce open cost?
Sale proceeds matter for profit/loss, but they are not open position cost. When you sell, only the carried cost of the sold lots leaves the position. This prevents remaining lot cost from becoming negative after a high-price sale.
Why separate transfer cost and broker cash?
Transfer-based cost tracks capital movement into the stock account. Broker cash shows available cash after trades. Keeping them separate helps read invested capital, available cash, and open position value without mixing them.
What changes when live quotes are available?
Live quotes show current market value for open lots. The cost ledger still comes from historical buy/sell records. Cost, market value, and profit/loss should be interpreted as separate signals.
Currency and commodities: rates, quantity, cost, and live value
Currency and commodity accounts have two main readings: recorded cost and current market equivalent. BudgetShot keeps these views separate so total assets stay easier to understand.
How does a currency account affect total assets?
Currency balance is stored in its own currency. When total assets are shown in the base currency, the relevant exchange rate is used. Historical month views should use rate data near that period; current views can use live or latest available rates.
How should I think about currency cost and rate changes?
The account balance comes from your transactions. Rate movement changes its base-currency equivalent. Your currency amount can stay the same while total asset value rises or falls because the rate changed.
How is gold/silver quantity read?
Commodity transactions preserve form and multiplier details. Gram, quarter, or other definitions can be normalized into a canonical quantity. Cost comes from your recorded purchase data; live value comes from market price.
Why can live commodity value differ from cost?
Cost is what you recorded at purchase time. Live value is the estimated current market equivalent using today's commodity price and currency rate. The difference helps read how the position moved.
Income and expenses: record daily transactions
Transactions are the main record of money movement. Once each transaction has an account and category, budgets, cash flow, and monthly views become easier to understand.
- Choose income or expense.
- Enter amount, date, account, and category.
- Add a note so the transaction is easy to find later.
- After saving, dashboard and budget views update automatically.
Budget and dashboard: monthly asset detail and calculation differences
The dashboard gives a quick view of total assets, monthly budget, and portfolio status. In daily use, start here and then open detail screens when you need a deeper breakdown.
- Check monthly income and expense balance.
- See which account groups drive your asset distribution.
- Open detail screens to inspect monthly asset or budget breakdowns.
How should I read monthly asset detail?
Monthly asset detail shows how account balances and asset groups are formed for the selected period. Bank and cash values come from transactions, currency and commodity values use relevant rate or price data, and stock accounts combine cost and live portfolio context.
Why can calculation views differ?
Historical month views use records and rate or price data for that period. Current views can use live or latest available market data. Because of this, cost-based value and live market value do not have to match.
Monthly asset detail and live portfolio view: how to read the numbers
Monthly asset detail reads historical records by period; live portfolio view helps interpret today's market equivalent. They serve different purposes, so the same asset can appear with different values.
What is calculated in monthly asset detail?
For the selected month, bank/cash transactions, currency balances, commodity costs, debt/receivable effects, loan liabilities, and stock account state are evaluated together. The goal is to explain which components form your financial position at the end of that period.
What stands out in live view?
Live view emphasizes current values for market-linked items such as currencies, commodities, and stocks. Group share, cost versus market value, and change indicators are easier to read there.
How should I use 30-day and yearly comparisons?
The 30-day comparison is for short-term movement: recent portfolio direction, market effects, or cash flow impact. Yearly comparison gives the bigger picture: asset growth, seasonal movement, and long-term trend.
Why compare in gold, USD, or EUR terms?
If the base currency moves sharply, reading total assets only in that currency can be misleading. Comparing against gold, USD, or EUR helps understand whether the portfolio is preserving value in different reference units.
Live market: live value, trends, and reference comparisons
The live market view helps interpret finance records alongside market data. It does not replace accounting records; it supports the current portfolio view.
- Exchange rates and commodity prices update when needed.
- Stock symbols use available quote sources.
- If a network request fails, cache or fallback sources help keep the view stable.
What details are visible in the live view?
The live view separates the total portfolio by account groups and shows each group's share. For currency, commodity, and stock items, it helps compare current value with recorded cost.
How do 30-day and yearly comparisons help?
Trend panels help you see portfolio change over the last 30 days or a longer period. The 30-day view is useful for short-term movement, while yearly comparison is better for broader direction.
Why compare against gold or another currency?
You may want to read total assets in references other than your base currency. Viewing the portfolio in gold, USD, or EUR terms can reduce the noise of local currency movement. It is a comparison tool, not investment advice.
Why are cost and market value separate?
Cost comes from your transaction ledger. Market value comes from live or latest available prices. Keeping them separate helps you understand both invested capital and current portfolio view.
Backup and export: keep control of your data
BudgetShot provides JSON backup and restore tools so you can move data outside the app. Creating a manual backup before major changes is a good habit.
- Open backup or export options in Settings.
- Create a manual JSON backup.
- Keep the exported file somewhere safe.
- When needed, import the backup file from the same area.
iCloud and local storage: what does each option mean?
Local storage keeps data on this device. iCloud sync uses your Apple ID to sync between devices. If the environment is not ready for iCloud, the app can continue with local storage.
Notifications: avoid missing payment dates
If you grant notification permission, the app can schedule local reminders for payment or credit card dates. You can change this permission in iOS Settings.
Frequently asked questions.
Short answers for users arriving from the App Store page.
Does BudgetShot store my data on a developer server?
No. Data is stored on your device. If you choose iCloud, data syncs through your private Apple CloudKit database.
Does the app include ads or tracking?
The current version does not include advertising, third-party tracking, or a developer-controlled analytics account.
Where does market data come from?
Exchange rate, commodity, and stock views may use third-party market sources such as Yahoo Finance, Frankfurter, and Canlidoviz.
How can I send a support request?
You can send bug reports, privacy questions, and feature requests through the Google Form on the support page.
Can I back up my data?
Yes. The app provides local backup, export, and restore tools.